




News & Insights
9 Min Read
Why 2026 Is Different: The Case for Investing Now
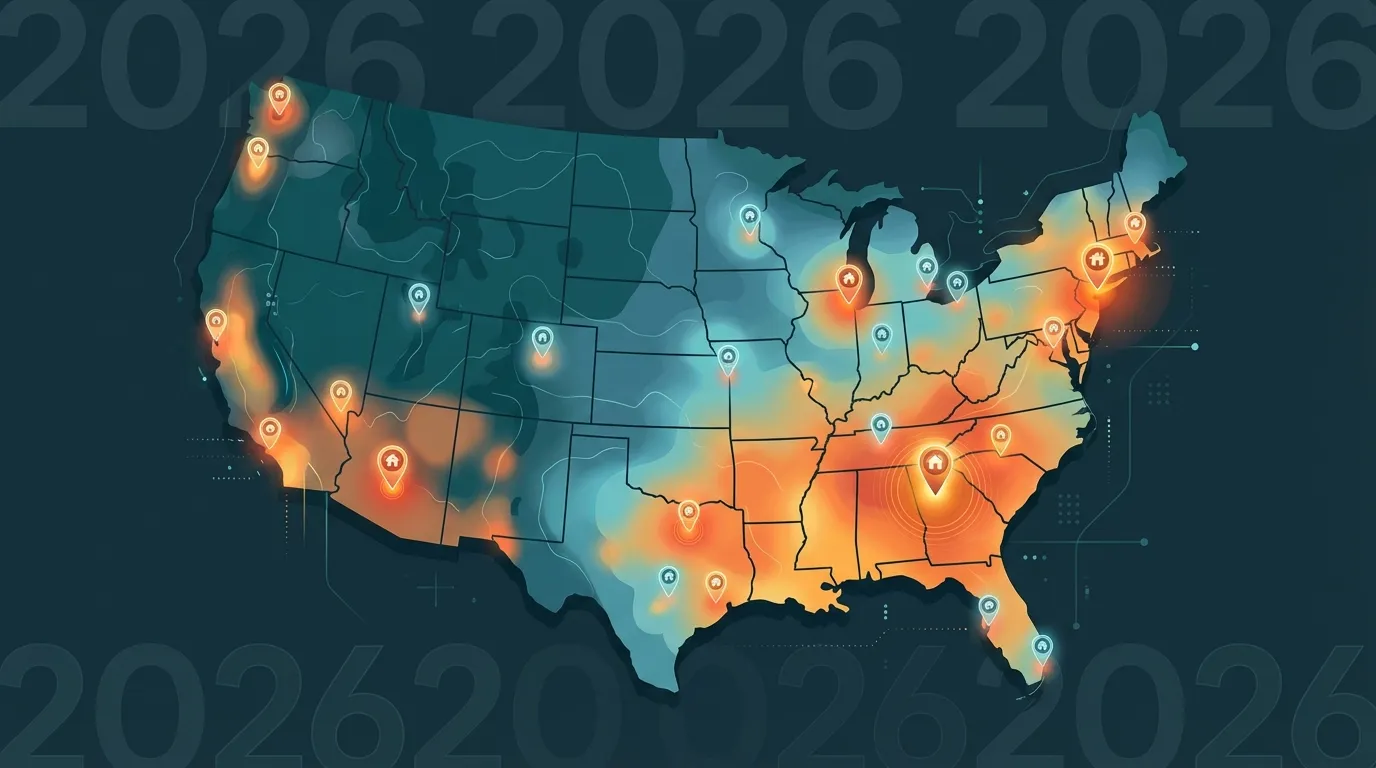
Before we get into specific markets, it is worth understanding why AirDNA is calling 2026 a turning point rather than just another year.
Supply growth has finally slowed. At the peak of the post-pandemic STR boom, supply was growing at roughly 20% annually. New hosts flooded every market. Competition intensified, occupancy rates fell, and returns compressed. That era is over. Supply growth is now tracking at 4.6% nationally, a level that demand can actually absorb.
ADR is recovering. After years of flat or declining average daily rates in many markets, rates are starting to strengthen. A +1.5% national ADR increase may not sound dramatic, but in a market where RevPAR was declining year-over-year, it represents a genuine inflection point.
Regulatory clarity has arrived. In 2022 and 2023, regulatory uncertainty was the biggest risk for STR investors. Most major markets have now settled their rules, permit requirements, licensing frameworks, occupancy limits. You may not love every regulation, but you can at least underwrite around them. Uncertainty is what kills investment returns; clarity, even restrictive clarity, at least lets you model the business.
The FIFA World Cup. This is the most significant demand event in the history of US short-term rentals. The 2026 World Cup will be the largest in history, 48 teams, 104 matches, spread across 16 cities in the US, Canada, and Mexico. The tournament runs June 11 through July 19, 2026. For the host cities, this is a 5-6 week period of exceptional demand with very limited hotel inventory.
Smart operators are winning. The easy-money era, where you could throw any property on Airbnb and make a profit, is over. What remains is a real business that rewards operators who have systems: dynamic pricing, professional photography, optimized listings, responsive guest communication. The hosts who built those systems during the difficult years of 2022-2024 are positioned extremely well as market conditions improve.
Related: Is Airbnb Worth It in 2026? Honest Breakdown for New Investors
How We Ranked These Cities
Every city on this list was evaluated across six criteria:
RevPAR growth, Revenue per available room is the single most important metric for STR investing. It captures both occupancy and pricing in one number. We prioritized markets showing positive RevPAR growth heading into 2026.
Occupancy rates and trends, Is the market filling up? Is occupancy increasing, flat, or declining? We want markets where demand is absorbing available supply.
ADR trends, Are hosts able to charge more year-over-year, or are they discounting to fill nights? Rising ADR indicates healthy demand and pricing power.
Supply growth, Lower supply growth means less competition entering the market. A market with strong demand and slow supply growth is the ideal combination.
Regulatory environment, We assessed how investor-friendly each city's STR regulations are, including permit requirements, licensing burdens, and the risk of future restrictions.
Special demand drivers, World Cup host status, major annual events, university demand, corporate travel, medical tourism, and other factors that create predictable, recurring demand.
For World Cup host cities, we also assessed the expected revenue impact during the tournament window. See our detailed breakdown in the 2026 World Cup Airbnb Pricing Guide.
The 15 Best Cities for Airbnb Investment in 2026
1. Philadelphia, Pennsylvania
RevPAR Growth: +6.3% | Occupancy: ~68% | ADR: ~$175/night | World Cup Host: Yes
Philadelphia leads our list with the strongest RevPAR growth of any major US market heading into 2026. The +6.3% RevPAR increase reflects both improving demand fundamentals and a supply picture that remains manageable compared to peer cities.
Philadelphia is a FIFA World Cup host city, which is the single biggest near-term demand driver any STR market can have in 2026. Lincoln Financial Field and Citizens Bank Park will host matches, with the city expecting hundreds of thousands of additional visitors during the June-July tournament window. Hotels are already booking out. STR rates during World Cup weeks in Philadelphia are projected to be among the highest in the tournament.
Beyond the World Cup, Philadelphia has structural demand advantages that make it a compelling long-term play. The city has two major universities (Penn and Drexel), a substantial convention calendar at the Pennsylvania Convention Center, strong medical tourism (Jefferson Health, Penn Medicine, CHOP), and proximity to New York and Washington DC makes it a natural stopover market.
Regulatory environment is manageable, the city requires a Certificate of Rental Suitability and hosts must pay hotel tax, but the permitting process is functional and the rules are settled.
Best property type: 2-3 bedroom row homes in Fishtown, Northern Liberties, or South Philly. Walking distance to transit is key. Estimated monthly revenue range: $3,500-$6,500 during peak, $2,200-$3,800 in off-peak months.
Risk to watch: Noise ordinances and neighbor complaints. Row home density means guest noise can be an issue. Screen guests carefully and set clear house rules.
2. Jersey City / Newark, New Jersey
RevPAR Growth: +5.6% | Occupancy: ~71% | ADR: ~$195/night | World Cup Host: Yes (MetLife Stadium)
Jersey City and Newark benefit from one of the most powerful demand setups in the entire country: overflow demand from New York City, combined with a World Cup host venue that seats 82,500 people.
MetLife Stadium in East Rutherford is the designated World Cup venue for the greater New York market, and it will host the tournament final on July 19, 2026, the single most watched sporting event on the planet. The final alone will generate extraordinary demand for STRs across the entire metro. Jersey City and Newark properties are positioned to capture guests who cannot find (or afford) Manhattan options.
The fundamental thesis here is NYC overflow arbitrage. Manhattan hotel rates regularly exceed $400-600/night. Travelers who want the NYC experience at half the price book in Jersey City, which offers a 10-minute PATH train ride to lower Manhattan. That dynamic has driven the +5.6% RevPAR growth and is structural, not cyclical.
Regulatory environment is more complex, Jersey City has implemented STR regulations requiring host registration, and property types matter (owner-occupied vs. investor-owned units face different rules). Newark has a lighter regulatory touch. Do your jurisdiction-specific homework before purchasing.
Best property type: 1-2 bedroom apartments in Jersey City's Journal Square or Paulus Hook neighborhoods. Proximity to PATH stations is the #1 factor. Estimated monthly revenue range: $2,800-$5,200 for a 1BR, $4,000-$7,500 for 2BR during World Cup.
Risk to watch: Regulatory changes. Jersey City has signaled potential additional restrictions. Underwrite conservatively on regulation.
3. Dallas / Fort Worth, Texas
RevPAR Growth: +5.5% | Occupancy: ~65% | ADR: ~$165/night | World Cup Host: Yes (AT&T Stadium)
Dallas-Fort Worth is one of the most compelling all-around STR markets in the country, and the World Cup adds a significant near-term catalyst. AT&T Stadium in Arlington will host matches, bringing international visitors to a metro that is already one of the fastest-growing in the US.
The DFW market benefits from extraordinarily diverse demand: corporate travel (the metro has more Fortune 500 headquarters than any city except New York), convention business at the Kay Bailey Hutchison Convention Center, sports tourism (Cowboys, Rangers, Mavs, Stars), and year-round leisure demand driven by the city's restaurant, arts, and entertainment scene.
Texas's regulatory environment is among the most STR-friendly in the country. The state has pre-emption laws that limit local governments' ability to ban STRs outright. Individual cities have their own permit requirements, but the framework is stable and investable.
Supply growth in DFW is moderate, which is the one note of caution. The market has attracted significant STR investment and new supply has entered. The +5.5% RevPAR growth suggests demand is still outpacing supply, but this is a metric worth monitoring quarter-to-quarter.
Best property type: 3-4 bedroom homes near AT&T Stadium in Arlington for World Cup demand; 1-2 bedroom units near Uptown Dallas or Deep Ellum for year-round corporate/leisure guests. Estimated monthly revenue range: $2,500-$4,500 baseline, with World Cup weeks potentially reaching 3-4x normal rates.
Risk to watch: New supply. The market is popular with investors, which means more competition entering over time.
4. Nashville, Tennessee
RevPAR Growth: ~+3.8% | Occupancy: ~72% | ADR: ~$220/night | World Cup Host: No
Nashville is not a World Cup host city, but it does not need the tournament to generate compelling returns. The city has built the most reliable leisure demand engine in the US STR market.
The bachelorette party and bachelor party market alone sustains substantial occupancy year-round. Nashville is the undisputed capital of that segment, the combination of honky-tonks on Broadway, rooftop bars, country music heritage, and an increasingly sophisticated restaurant scene draws group travel that other cities cannot replicate. Group travelers book larger properties (3-5 bedrooms), stay multiple nights, and pay premium rates.
Beyond group leisure, Nashville has meaningful corporate travel demand (healthcare and technology sectors are large employers), a growing convention market, and seasonal sports tourism (Predators, Titans, Vanderbilt athletics).
The 72% occupancy rate is one of the highest in the country for a non-coastal market and reflects genuine, diversified demand, not just a single event or season.
Regulatory environment: Nashville has implemented STR permits and caps on non-owner-occupied permits in certain zones. This is actually a positive signal for existing STR owners, regulation suppresses new supply, protecting the returns of permitted properties.
Best property type: 3-5 bedroom homes within 2 miles of Broadway (downtown). The group travel market pays significant premiums for larger properties near the entertainment district. A well-appointed 4BR can generate $6,000-$12,000/month during peak.
Risk to watch: Permit availability for non-owner-occupied properties is limited in prime zones. Research permit availability before purchasing.
5. Miami, Florida
RevPAR Growth: ~+3.2% | Occupancy: ~74% | ADR: ~$285/night | World Cup Host: Yes (Hard Rock Stadium)**
Miami is the premium market on this list, highest ADR, strongest international tourism profile, and World Cup host status for one of the most coveted venues in North American soccer. Hard Rock Stadium will host multiple matches, and Miami's international identity makes it a destination for soccer fans from Latin America and Europe who are already inclined to visit the city.
The Miami STR market is mature and competitive, which is why it ranks 5th rather than 1st despite its premium metrics. RevPAR growth is positive but more modest than emerging markets. The high ADR creates high revenue potential, but also means properties are more expensive to acquire, which compresses cap rates.
Miami's demand is genuinely diversified: Art Basel (December), Ultra Music Festival (March), international tourism year-round, spring break (March-April), summer domestic tourism, and the World Cup. The seasonality curve is actually more favorable than most beach markets, while summer sees a brief dip, Miami runs relatively high occupancy 10-11 months per year.
Regulatory environment: Miami-Dade and the individual municipalities (Miami Beach, Surfside, etc.) have complex and sometimes restrictive STR rules. Miami Beach in particular has significant restrictions. Do zone-by-zone research before purchasing, the rules vary dramatically by neighborhood.
Best property type: 2-3 bedroom condos or homes in Wynwood, Little Havana, or Brickell for consistent performance. Avoid Miami Beach until you have confirmed the specific unit's permit status. Estimated monthly revenue: $4,000-$8,500 for a 2BR in a solid location.
Risk to watch: Regulatory complexity and condo association rules. Many condo buildings prohibit short-term rentals. Verify before purchasing.
6. Austin, Texas
RevPAR Growth: ~+3.5% | Occupancy: ~67% | ADR: ~$195/night | World Cup Host: No
Austin is a market that frustrated investors who bought at peak 2021-2022 prices as supply surged dramatically. The market is now digesting that supply, and the fundamentals remain compelling for investors who can underwrite appropriately.
The demand profile is exceptional: SXSW (March) is the most economically impactful music/tech festival in the US, followed by Austin City Limits (October), Formula 1 at Circuit of the Americas (November), and a year-round baseline of tech industry events, university demand (UT Austin enrollment: 50,000+), and increasingly strong convention business.
Texas regulatory environment is favorable, similar to DFW, state-level protections limit local restrictions. Austin's own STR rules are primarily focused on owner-occupied vs. non-owner-occupied classifications, with the latter facing more scrutiny in residential zones.
The key to Austin underwriting in 2026 is pricing, properties purchased at 2021 valuations may still be underwater on a cash flow basis. The opportunity is in properties that can be acquired at current (more realistic) valuations that reflect normalized occupancy rather than pandemic-era peaks.
Best property type: 2-3 bedroom homes or unique/quirky properties near the East Austin entertainment corridor or within 3 miles of downtown. Austin rewards distinctive properties, unique architecture, rooftop decks, or themed spaces outperform generic listings. Estimated monthly revenue: $2,800-$5,500 baseline, $8,000-$15,000+ during SXSW week.
Risk to watch: Oversupply in certain submarkets. The east side has seen significant new supply. Research specific neighborhoods rather than treating Austin as a uniform market.
7. Houston, Texas
RevPAR Growth: ~+4.1% | Occupancy: ~63% | ADR: ~$148/night | World Cup Host: Yes (NRG Stadium)
Houston is the overlooked World Cup market. While Dallas and Miami get more attention, NRG Stadium will host multiple matches, including the US Men's National Team opener, the single most in-demand ticket in US soccer history. Yet Houston's STR market has not yet priced in the World Cup premium the way other host cities have.
The opportunity is a combination of World Cup upside, a structural demand base that most investors underestimate, and one of the lowest barriers to entry of any major US metro.
Houston's demand drivers are genuinely diverse: the Texas Medical Center (the world's largest medical complex) generates substantial medical tourism and healthcare professional relocations year-round; the energy industry drives significant corporate travel; the Port of Houston creates maritime industry visitors; and the city's underrated restaurant and arts scene is increasingly driving leisure tourism.
Median home prices in Houston are dramatically lower than other major metros, which means lower acquisition costs, better cash-on-cash returns at similar ADR levels, and more forgiving underwriting if occupancy underperforms.
Texas STR regulations apply, relatively investor-friendly with stable rules.
Best property type: 3-4 bedroom homes near the Medical Center, Midtown, or Montrose neighborhoods. Medical Center proximity generates reliable, high-quality (healthcare professional) bookings year-round. Estimated monthly revenue: $2,200-$4,200, with World Cup weeks potentially reaching 5-8x normal ADR.
Risk to watch: The lower ADR means operations efficiency matters more. Thin margins require disciplined cost management.
Want to check a market that is not on this list? Use the free Find Profitable STRs tool at playground.hosteasy.ai, enter any city and get instant market data on profitability, occupancy, and competition. Free, no signup required.
8. Scottsdale / Phoenix, Arizona
RevPAR Growth: ~+2.8% | Occupancy: ~66% | ADR: ~$210/night | World Cup Host: No
Scottsdale and Phoenix represent the most reliable seasonal STR play in the country. The snowbird market, retirees and cold-weather-escapers booking 2-4 week stays from November through April, provides a demand base unlike any other US city.
The March-April window is extraordinary. Spring training (Cactus League), the Waste Management Phoenix Open (the largest-attended golf tournament in the world), and the general snowbird peak create a period where supply is essentially fully absorbed and rates spike dramatically. A well-positioned Scottsdale property in March can generate 50-80% of its annual revenue in a single month.
The year-round picture is more nuanced. Phoenix summers are genuinely difficult from an occupancy standpoint, the heat drives away leisure travelers and rates compress significantly June through September. Successful operators in this market either have a strategy for summer inventory (longer-term stays, travel nurses, home renovation crews) or model the business based primarily on the October-April season.
No World Cup designation, but the Super Bowl LXI returns to Phoenix/Glendale in 2027, which makes this a market where events infrastructure is already proven.
Best property type: Pool homes in Scottsdale, Tempe, or Chandler with outdoor entertaining space. The pool is essentially mandatory for competitive positioning. Golf course proximity adds premium. Estimated monthly revenue: $1,800-$3,200 in summer, $5,000-$12,000+ during March peak.
Risk to watch: Extreme seasonality creates cash flow management challenges. Budget carefully for the summer trough.
9. Seattle, Washington
RevPAR Growth: ~+3.3% | Occupancy: ~69% | ADR: ~$205/night | World Cup Host: Yes (Lumen Field)**
Seattle is a World Cup host city with one of the most attractive year-round demand profiles in the Pacific Northwest. Lumen Field, home of the Seahawks and Sounders, will host matches, and Seattle's existing reputation as a soccer city (the Sounders are one of MLS's best-supported clubs) means genuine local enthusiasm for the tournament.
Tech industry corporate travel (Amazon, Microsoft, Boeing) provides a reliable weekday demand base that smooths out the leisure-heavy weekends. This combination of corporate midweek and leisure weekend demand is the ideal profile for maximizing occupancy.
Seattle's summer tourism (June-September) is genuinely extraordinary. The city transforms from rainy-season gray to one of the most beautiful destinations in North America, Pike Place Market, the Olympic Peninsula, Rainier, the San Juan Islands, and the general Pacific Northwest outdoor experience draw massive tourist volumes. Summer occupancy in well-positioned Seattle properties frequently exceeds 90%.
Regulatory environment: Seattle has STR regulations requiring a business license and primary residence restrictions for non-owner-occupied properties. This has suppressed supply growth and actually protects existing legitimate operators' market position.
Best property type: 1-2 bedroom units in Capitol Hill, Ballard, or Queen Anne. Properties with skyline views or proximity to Pike Place command significant premiums. Estimated monthly revenue: $2,500-$4,500 in winter, $4,500-$7,500 in summer peak.
Risk to watch: Primary residence restrictions limit non-owner-occupied STR supply, which is good for competition but limits how investors can enter the market. Research the specific regulatory requirements for your intended property type.
10. San Antonio, Texas
RevPAR Growth: ~+2.5% | Occupancy: ~64% | ADR: ~$138/night | World Cup Host: No
San Antonio is the value play on this list, low acquisition costs, steady tourism demand anchored by the Alamo and the River Walk, and a military-adjacent demand base that provides recession-resistant bookings.
The city draws approximately 38 million visitors annually, making it one of the most-visited destinations in Texas. That tourism base is consistent and predictable, not driven by any single event, but by a deep calendar of conventions, the River Walk entertainment district, and year-round leisure tourism. Family groups visiting the Alamo, military families visiting Fort Sam Houston and Lackland Air Force Base, and corporate groups attending conventions provide demand that is genuinely diversified.
The lower ADR means this is a volume-and-efficiency story. Properties here generate less revenue per night than Miami or Nashville, but acquisition costs are proportionally lower and the demand is more predictable. For an investor focused on steady cash-on-cash returns rather than top-line revenue, San Antonio's economics can be compelling.
Texas STR regulations apply, investor-friendly environment with stable rules.
Best property type: 2-3 bedroom homes within walking distance of the River Walk or in the King William Historic District. Historic character adds significant booking appeal. Estimated monthly revenue: $1,800-$3,500 for well-positioned properties.
Risk to watch: Lower ADR requires cost discipline. Management efficiency matters more here than in premium-rate markets.
11. Kansas City, Missouri
RevPAR Growth: ~+3.8% | Occupancy: ~62% | ADR: ~$155/night | World Cup Host: Yes (Arrowhead Stadium)**
Kansas City is the most underrated World Cup market in the country, and arguably the most interesting emerging opportunity for 2026.
Arrowhead Stadium will host multiple matches, including potentially a quarterfinal. The city has never hosted an event at this scale. Hotel inventory is limited relative to the expected visitor volume, which creates an extraordinary window for STR operators. Unlike Miami or Los Angeles, where visitors have abundant accommodation options, Kansas City's more constrained hotel market means STR demand during World Cup weeks should be exceptional.
Beyond the tournament, Kansas City's STR market has solid underlying fundamentals. The entertainment district around the Power & Light District, the Country Club Plaza, and the revitalized Crossroads Arts District have created a genuine leisure tourism draw. The Kansas City Chiefs' sustained NFL success has built sports tourism that fills weekends during football season. And the city's affordability relative to coastal markets creates favorable acquisition economics.
The risk is the flip side of the opportunity: Kansas City is an emerging STR market with lower baseline occupancy (62%) and shorter track record. Revenue projections carry more uncertainty than established markets.
Best property type: 2-3 bedroom homes in the Westside, Crossroads, or Brookside neighborhoods. Proximity to Arrowhead is valuable for sports weekends but can be remote for leisure travelers, balance accordingly. Estimated monthly revenue: $2,000-$3,800 baseline, with World Cup weeks projected to be among the highest-earning windows in the tournament.
Risk to watch: Emerging market risk. Less data, less certainty. Conservative underwriting is essential.
12. Atlanta, Georgia
RevPAR Growth: ~+2.9% | Occupancy: ~66% | ADR: ~$162/night | World Cup Host: No
Atlanta is the convention machine of the Southeast, and that corporate/convention demand base makes it one of the most reliable STR markets in the region.
The Georgia World Congress Center is one of the largest convention centers in the US. When major conventions hit Atlanta, and they hit multiple times per month, hotel inventory fills and STR demand surges. The city also hosts Dragon Con (one of the largest sci-fi/fantasy conventions in the world, 80,000+ attendees), the SEC Championship, and a growing film industry (Georgia's production tax credits have made Atlanta the third-largest film market in the US, driving reliable corporate housing demand).
Atlanta's airport (Hartsfield-Jackson) is the busiest in the world, which means significant airline crew layover demand for STR operators located near the airport, a niche but reliable revenue stream.
Georgia's regulatory environment is relatively STR-friendly, with rules concentrated at the city/county level rather than state-level restrictions.
Best property type: 2-3 bedroom properties in Midtown, Virginia-Highland, or Inman Park for leisure/convention guests; near the airport for corporate/crew demand. Estimated monthly revenue: $2,400-$4,500 in well-positioned Midtown properties.
Risk to watch: No World Cup designation means Atlanta misses the 2026 tournament catalyst. Growth story is more gradual and convention-dependent.
13. Los Angeles, California
RevPAR Growth: ~+2.2% | ADR: ~$310/night | Occupancy: ~72% | World Cup Host: Yes (SoFi Stadium)**
Los Angeles is the premium World Cup market. SoFi Stadium in Inglewood will host the most matches of any US venue, and LA's existing status as a global tourism destination means the city has the international visitor infrastructure and brand recognition to maximize revenue from the tournament.
The honest caveat: Los Angeles is the hardest market on this list to invest in correctly.
California's regulatory environment for STRs is complex. Los Angeles City has a Home Sharing Ordinance that generally limits STRs to a host's primary residence and caps non-hosted stays. Enforcement has been inconsistent, but the rules create real investment risk for traditional investor-owned STRs. Certain areas (unincorporated LA County, some suburban cities) have more favorable frameworks.
The investment thesis for LA works best for: owner-occupants who host part of their primary residence; investors in cities within the LA metro that have more favorable STR regulations; and buyers of properties in vacation rental zones where the regulatory framework is clear.
Despite the regulatory complexity, the ADR premium ($310+ average) means that even modest occupancy generates significant revenue. A 60% occupied 2BR in a well-positioned LA neighborhood at $300/night generates $3,240/month. The math works when the regulatory framework permits it.
Best property type: 1-2 bedroom homes or ADUs (accessory dwelling units) where hosts can structure as compliant with LA's primary residence framework; or properties in Pasadena, Long Beach, or other LA metro cities with clearer STR rules. Estimated monthly revenue: $3,500-$7,000 for properly structured LA-area properties.
Risk to watch: Regulatory compliance is the primary concern. Invest significant due diligence in understanding the specific regulatory status of any property before purchasing.
14. Denver, Colorado
RevPAR Growth: ~+3.1% | Occupancy: ~67% | ADR: ~$185/night | World Cup Host: No
Denver is a four-season STR market built on one of the most compelling demand bases in the Mountain West, and it is the gateway city for arguably the highest-value tourism asset in the country: the Colorado ski and outdoor recreation economy.
The demand drivers stack reliably across all four seasons. Winter brings ski tourism (access to Vail, Breckenridge, Keystone, and Arapahoe Basin within 90 minutes). Spring and fall bring hiking and outdoor recreation visitors. Summer brings mountain tourism, music festivals (Red Rocks is one of the most iconic music venues in the world), and significant convention business. Denver has genuinely minimal off-season.
The outdoor recreation visitor demographic skews high-income and high-intent, these are travelers who plan months in advance, book longer stays, and are willing to pay for quality accommodations.
Denver's STR regulatory environment has evolved significantly. The city requires STR licenses and has primary residency requirements for certain property types. Denver proper is more restrictive than surrounding suburban markets (Aurora, Westminster, Arvada), which have lighter regulatory touches.
Best property type: Properties with mountain views, proximity to Red Rocks or Washington Park, or in neighborhoods like Capitol Hill, Highland, or Baker. Ski-access marketing (1-hour to slopes) adds significant booking leverage. Estimated monthly revenue: $2,800-$5,200 for well-positioned 2-3 bedroom properties.
Risk to watch: Primary residency restrictions in Denver proper limit traditional investor-owned STR structure. Explore suburban Denver markets where regulations are more favorable.
15. Savannah, Georgia
RevPAR Growth: ~+2.7% | Occupancy: ~69% | ADR: ~$172/night | World Cup Host: No
Savannah closes our list as the most accessible entry point for new STR investors, a combination of low acquisition costs, high STR-friendliness, strong occupancy, and a tourism identity that drives consistent demand.
Savannah is one of the most visited cities in the American South, drawing visitors to its historic squares, antebellum architecture, SCAD (the Savannah College of Art and Design, 14,000 students), and the cobblestone lanes of the Historic District. St. Patrick's Day (one of the largest celebrations in the US after New York), the Savannah Music Festival, and year-round ghost tour and history tourism create a demand calendar with genuine depth.
Crucially, Savannah has been relatively STR-friendly compared to comparable historic cities (Charleston, New Orleans, Asheville) that have implemented significant restrictions. The city requires STR business licenses and hotel-motel tax registration, but the framework permits legitimate investor-owned properties in most zones.
The property acquisition economics are genuinely favorable. Historic Savannah homes that would cost $1.5M+ in comparable Northern cities trade at $400K-$700K. The combination of reasonable acquisition costs, solid occupancy (69%), and consistent ADR creates attractive cash-on-cash return potential.
Best property type: Carriage houses, historic row homes, or renovated cottages in or near the Historic District. Authentic historic character is the #1 booking driver, guests come specifically for the Savannah aesthetic. Estimated monthly revenue: $2,500-$4,800 for well-positioned historic properties.
Risk to watch: Historic district property maintenance costs can be significant. Original features attract bookings but require careful stewardship. Budget for higher-than-average maintenance.
Cities to Watch: Honorable Mentions
Several markets did not make the top 15 but deserve attention depending on your investment thesis:
Toronto and Vancouver (Canada), Both are World Cup host cities with extraordinary projected demand for the tournament. The complication is Canada's increasingly complex STR regulatory environment, with federal and provincial policies pushing toward restriction. The World Cup window is compelling; the long-term operational environment requires careful due diligence.
Mexico City (Mexico), World Cup host and the beneficiary of a genuine tourism explosion. Mexico City has become one of the most popular long-stay destinations for remote workers (the "digital nomad" segment), and the cultural tourism draw is strengthening year-over-year. For investors comfortable with operating internationally and navigating Mexican property law, this is an emerging opportunity worth watching.
Boise, Idaho, An emerging STR market with strong occupancy metrics, a growing tech economy, and proximity to outdoor recreation. Lower ADR than major metros but also lower acquisition costs and minimal regulatory burden.
Chattanooga, Tennessee, Often overlooked relative to Nashville, Chattanooga has built a strong STR market around outdoor recreation (Tennessee River gorge, Rock City, Lookout Mountain), a revitalized downtown, and positioning as a more accessible alternative to Asheville. STR-friendly regulations and affordable property prices make it compelling for value-focused investors.
How to Research Any Market Yourself
The cities on this list represent strong opportunities based on current data, but the best market for your investment depends on factors specific to your situation: acquisition budget, financing access, risk tolerance, distance from the property, and operational capacity.
Here is how to run your own market analysis in 15 minutes:
Free option: playground.hosteasy.ai. The "Find Profitable STRs" tool at playground.hosteasy.ai lets you enter any city or zip code and get instant market data, occupancy rates, average daily rates, revenue estimates, and market trends. It is free, requires no signup, and gives you a legitimate starting point for evaluating any market. Start here.
AirDNA. The industry standard for STR market data. Paid subscription, but the most comprehensive data available. If you are serious about investing, the cost is a rounding error compared to your acquisition costs. AirDNA's MarketMinder tool lets you drill into specific neighborhoods and property types, not just city-level averages.
Mashvisor. An alternative to AirDNA with a slightly different methodology. Useful for comparing multiple markets side-by-side and for integration with traditional real estate metrics (cap rates, cash-on-cash returns).
What metrics to look at:
Occupancy rate. Healthy markets run 60-75%+ annually. Below 55% suggests oversupply or insufficient demand.
ADR trend. Is it rising, flat, or declining year-over-year? Rising ADR indicates pricing power.
RevPAR. The single best summary metric, combines occupancy and rate in one number. Look for positive year-over-year growth.
Supply growth. How many new listings entered the market in the past 12 months? High supply growth (10%+) in a market you are targeting is a warning sign.
Seasonality. What does the occupancy curve look like month-to-month? Sharp seasonality means managing cash flow carefully during the trough.
Regulatory environment. Search "[city name] short term rental regulations 2026", this is non-negotiable due diligence.
Related: Is the Airbnb Market Saturated in 2026? What the Data Actually Shows
The Operational Reality: Finding a Market Is Step One
Market selection is the most important decision you will make, but it is not the only decision.
The STR investors who are generating strong returns in 2026 are not just the ones who picked good markets. They are the ones who built or hired the operational infrastructure to run those properties efficiently:
Dynamic pricing, manually managing pricing is leaving 15-25% of potential revenue on the table. Every competitive operator uses dynamic pricing software (PriceLabs, Wheelhouse, DPGO) or a management service that handles it for them.
Guest communication, response time and pre-arrival communication directly impacts your listing's search ranking in Airbnb's algorithm. Slow responses kill occupancy.
Cleaning coordination, the operational bottleneck that most self-managing hosts underestimate. A single turnover failure (late cleaner, inadequate supply of linens) can result in a 1-star review that takes months to recover from.
Listing optimization, professional photography, SEO-optimized descriptions, and regular headline testing are table stakes for competitive listings.
Guest screening, critical for protecting your property and maintaining neighbor relations.
The question is whether you want to build and manage those systems yourself or hire someone who has already built them.
Self-management can work exceptionally well for local operators who have the time and systems. For investors who are remote from their property, or who own multiple properties, or who simply want their time back, professional co-hosting or management is increasingly the rational choice.
Related: Airbnb Management Companies Compared: What You Actually Get for the Fee
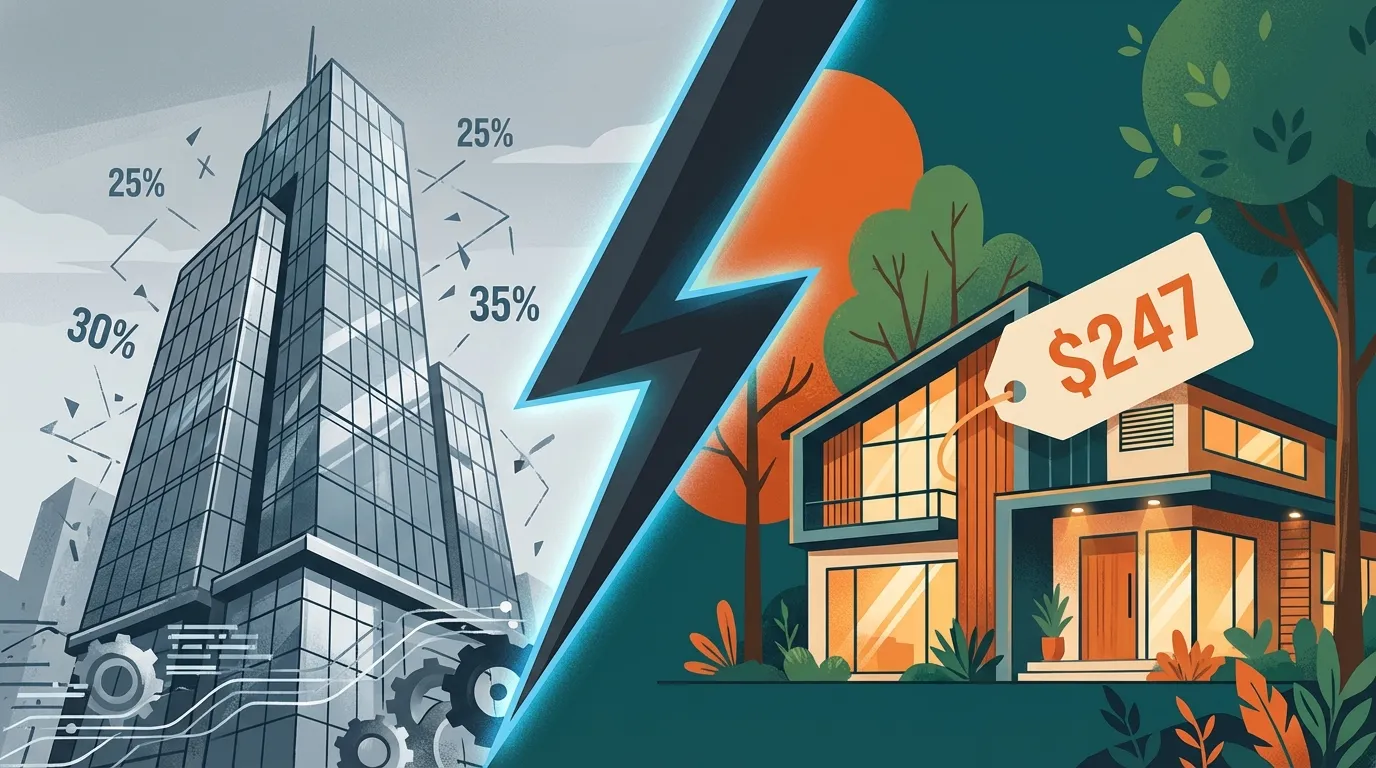
Found your market? Now you need operations. HostEasy manages your entire Airbnb operation for a flat $247/month, in any US market. Guest communication, cleaning coordination, dynamic pricing, guest screening. Start with $97 your first month →
The Bottom Line
AirDNA is right that 2026 represents the best entry point for STR investment since 2021. The supply/demand dynamics are genuinely improving. The World Cup is a once-in-a-generation demand event for the 16 host cities. And market maturation means that disciplined, systematic operators have a structural advantage over casual hosts who entered during the easy-money era.
But the thesis is not "buy any property in any city." It is "buy the right property in a well-chosen market and operate it with genuine professionalism."
The 15 cities on this list give you strong starting points. Philadelphia, Jersey City, and Dallas lead on RevPAR momentum. Nashville and Austin offer proven event-driven demand. Houston, San Antonio, and Kansas City offer favorable acquisition economics. Miami, Seattle, and Los Angeles offer premium ADR with appropriate caveats.
Do your own analysis. The market data tools exist. The regulatory research is publicly available. The financial modeling is straightforward.
And when you are ready to invest, make sure your operations are as strong as your market selection.
Join our newsletter list
Sign up to get the most recent blog articles in your email every week.
Similar Topic
Related Blogs


More Articles